Navigating the ASX: Identifying Strong Uptrends and Downtrends
For investors looking to pinpoint promising opportunities and potential risks on the Australian Securities Exchange (ASX), a systematic approach is key. This analysis delves into identifying stocks exhibiting robust upward momentum and those experiencing significant downward pressure, based on a trend-following technical analysis methodology. The aim is to provide a clear snapshot of the market’s leading performers and laggards, offering valuable insights for informed investment decisions.
The lists presented here are designed to be a practical tool for traders and investors. Whether you prefer to capitalise on stocks in strong uptrends or strategically avoid, sell, or even short sell those in pronounced downtrends, the choice of how to utilise this information rests entirely with you. For those who wish to integrate this data into their trading workflow, the tables can be readily converted into formats compatible with popular trading platforms like TradingView. This allows for seamless navigation between charts, enabling a quick and efficient assessment of the ASX’s strongest uptrends and downtrends.
It’s important to note that many companies appearing on these lists may have been featured previously. Their consistent presence is a testament to their ongoing adherence to the defined trend criteria. However, it is crucial to understand that this analysis does not provide alerts when a stock’s trend changes. Therefore, conducting your own due diligence to confirm the sustainability of any trend is paramount.
ASX Uptrends Scan List 📈
This section highlights companies demonstrating strong positive price momentum. These stocks have met specific technical criteria indicating a healthy uptrend, suggesting potential for continued growth.
- 4DMedical (4DX)
- Last Price: $4.33
- 1mo %: +37.5%
- 1yr %: +1024.7%
- The A2 Milk Co. (A2M)
- Last Price: $9.96
- 1mo %: +16.8%
- 1yr %: +25.0%
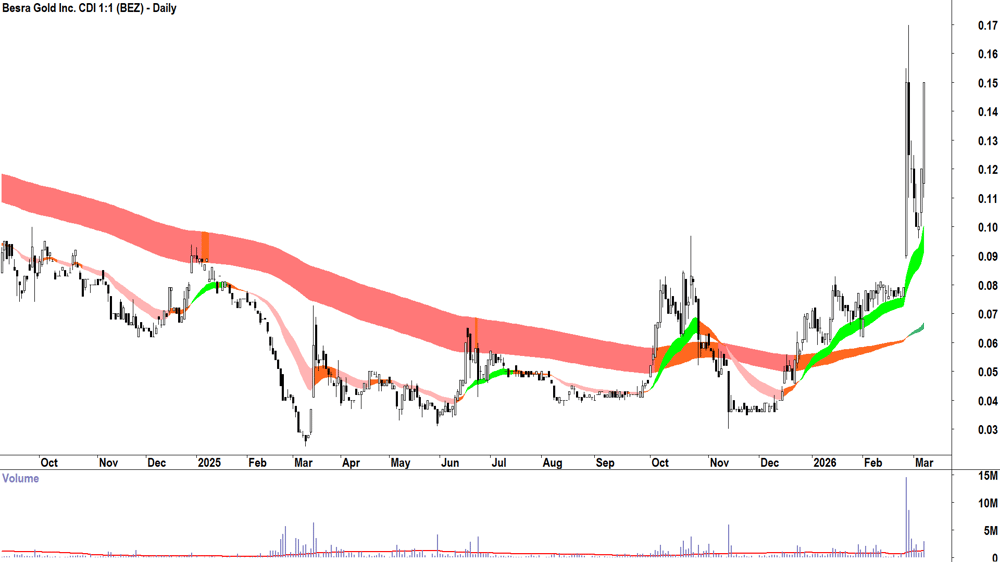
- Besra Gold (BEZ)
- Last Price: $0.150
- 1mo %: +92.3%
- 1yr %: +194.1%
- Brazilian Rare Earths (BRE)
- Last Price: $5.36
- 1mo %: +39.6%
- 1yr %: +197.0%
- Bioxyne (BXN)
- Last Price: $0.059
- 1mo %: +37.2%
- 1yr %: +96.7%
- Chrysos Corp. (C79)
- Last Price: $9.67
- 1mo %: +33.4%
- 1yr %: +108.4%
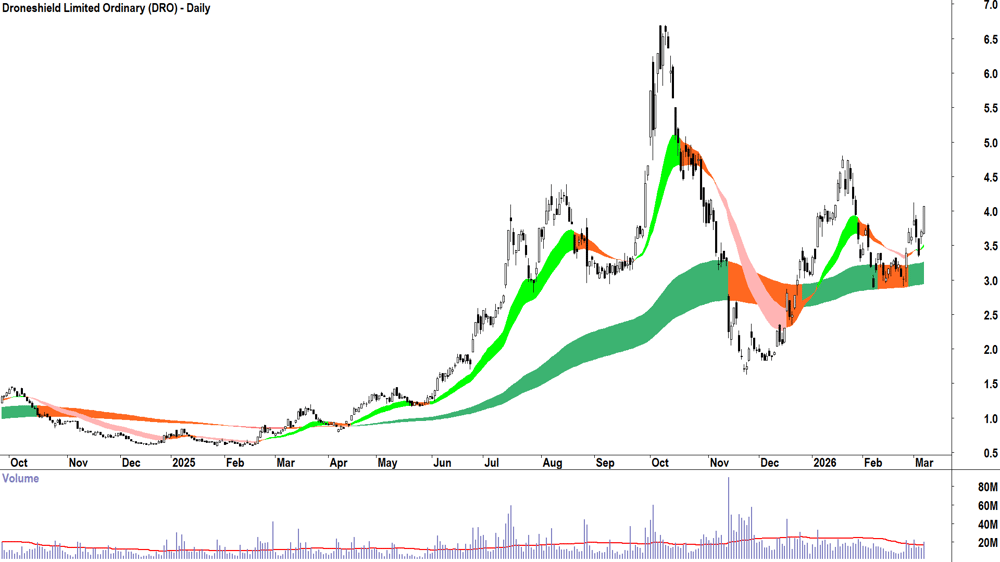
- Droneshield (DRO)
- Last Price: $4.07
- 1mo %: +27.6%
- 1yr %: +418.5%
- Dateline Resources (DTR)
- Last Price: $0.395
- 1mo %: +31.7%
- 1yr %: +13066.7%
- Duratec (DUR)
- Last Price: $2.32
- 1mo %: +4.5%
- 1yr %: +47.3%
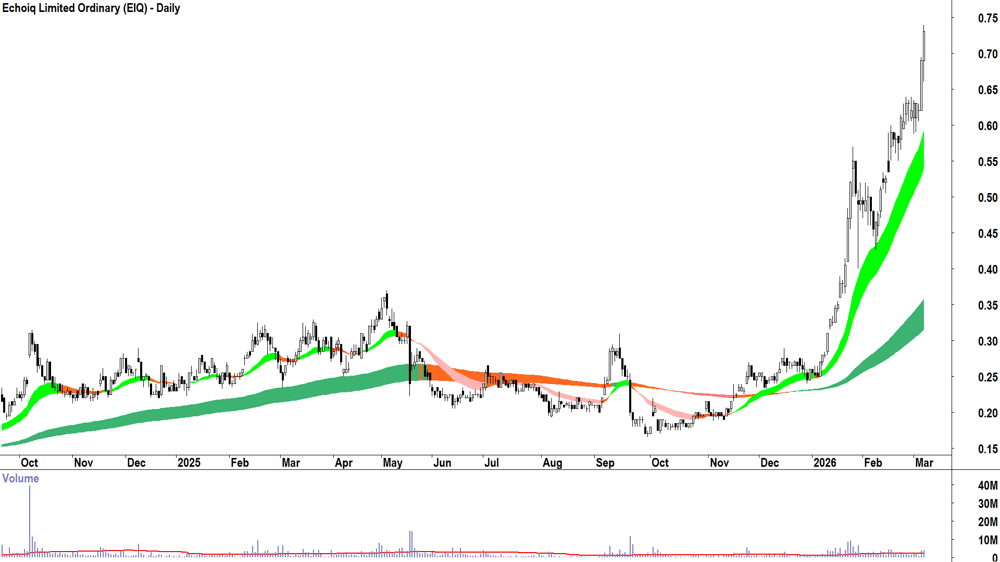
- Echoiq (EIQ)
- Last Price: $0.730
- 1mo %: +52.1%
- 1yr %: +170.4%
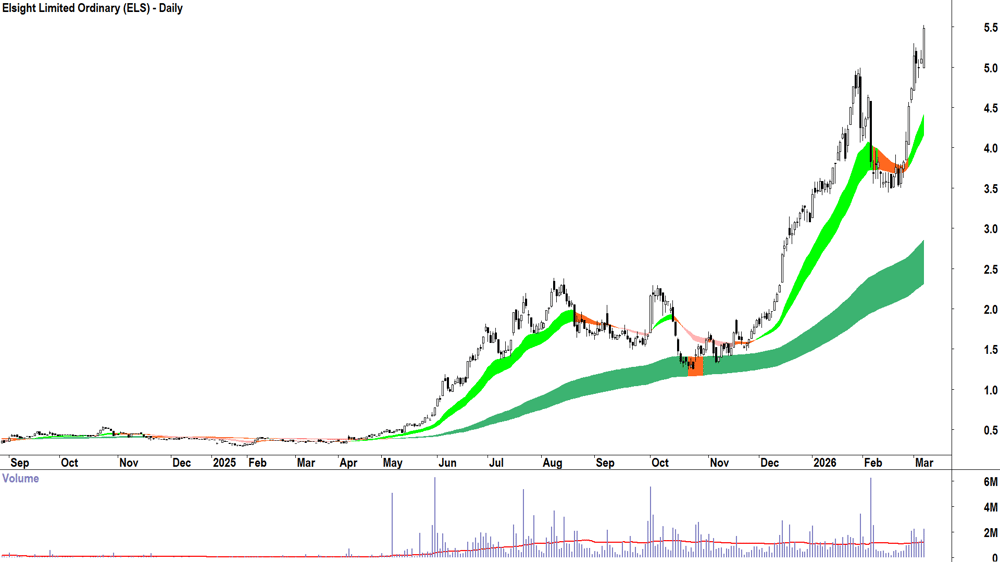
- Elsight (ELS)
- Last Price: $5.48
- 1mo %: +43.1%
- 1yr %: +1401.4%
- Fortifai (FTI)
- Last Price: $0.450
- 1mo %: +83.7%
- 1yr %: +1353.4%
- L1 Group (L1G)
- Last Price: $1.270
- 1mo %: +10.9%
- 1yr %: +117.1%
- Lindian Resources (LIN)
- Last Price: $0.760
- 1mo %: +85.4%
- 1yr %: +667.7%
- Magellan Financial Group (MFG)
- Last Price: $11.55
- 1mo %: +32.2%
- 1yr %: +40.8%
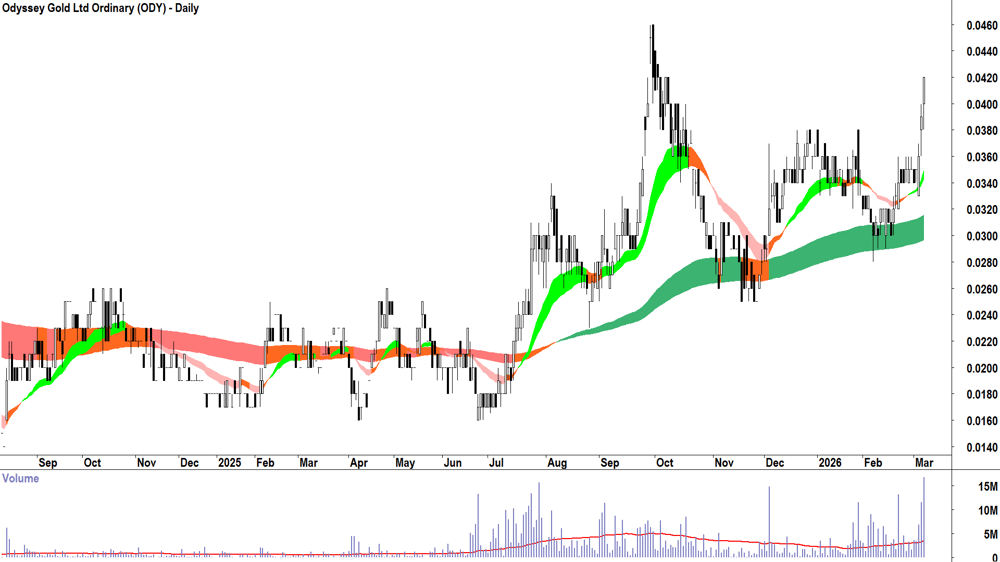
- Odyssey Gold (ODY)
- Last Price: $0.042
- 1mo %: +35.5%
- 1yr %: +75.0%
- BetaShares Crude Oil ETF (OOO)
- Last Price: $7.13
- 1mo %: +26.4%
- 1yr %: +32.3%
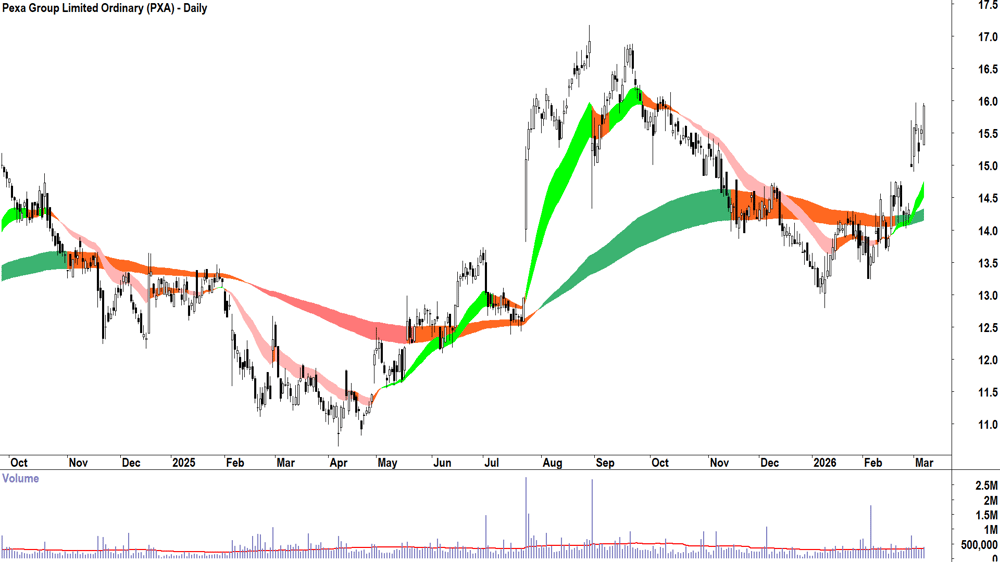
- Pexa Group (PXA)
- Last Price: $15.92
- 1mo %: +17.1%
- 1yr %: +35.7%
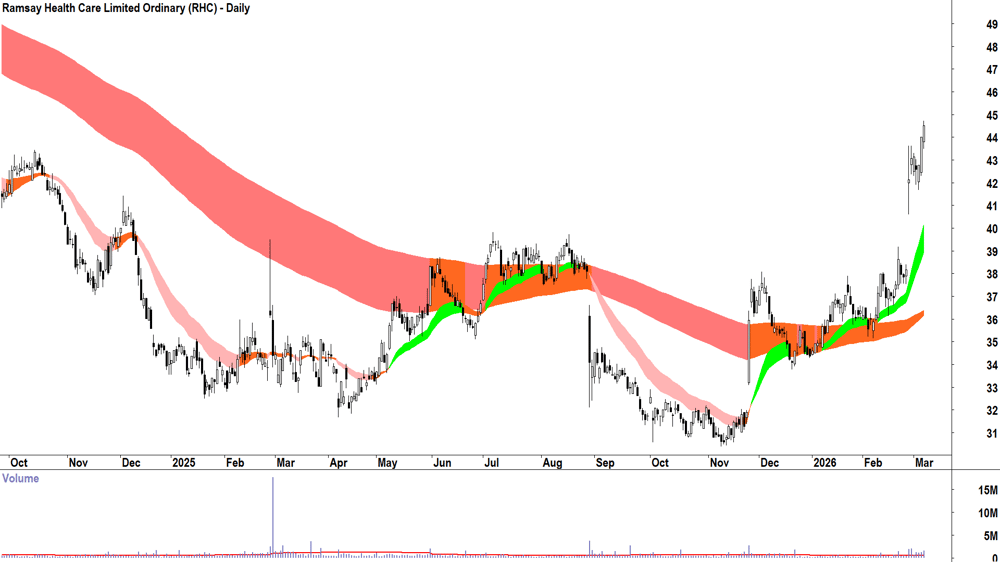
- Ramsay Health Care (RHC)
- Last Price: $44.52
- 1mo %: +23.6%
- 1yr %: +32.7%
- Red Hill Minerals (RHI)
- Last Price: $5.12
- 1mo %: +7.8%
- 1yr %: +48.8%
- Sportshero (SHO)
- Last Price: $0.135
- 1mo %: +70.9%
- 1yr %: +610.5%
- Sky Metals (SKY)
- Last Price: $0.175
- 1mo %: +6.1%
- 1yr %: +236.5%
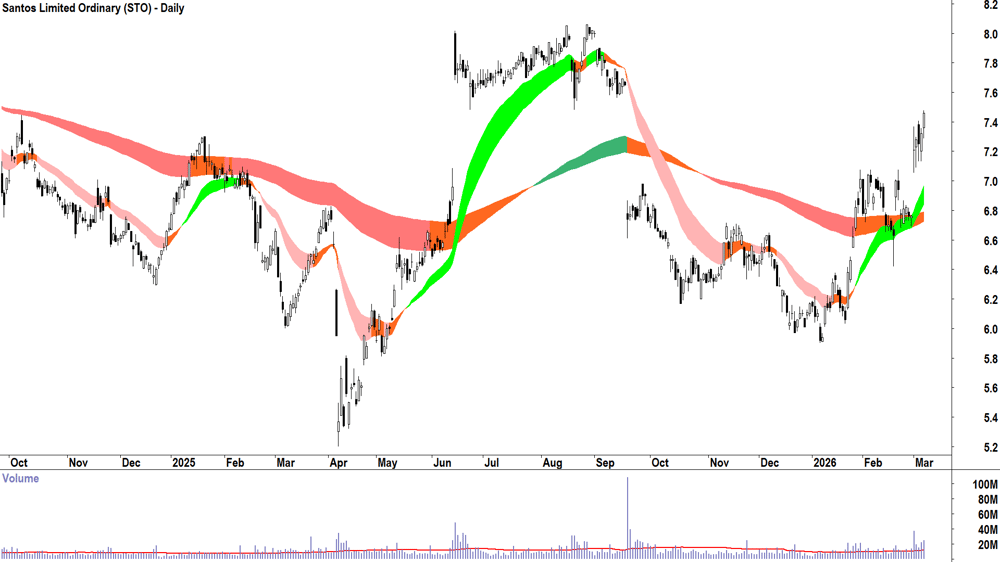
- Santos (STO)
- Last Price: $7.46
- 1mo %: +6.7%
- 1yr %: +17.5%
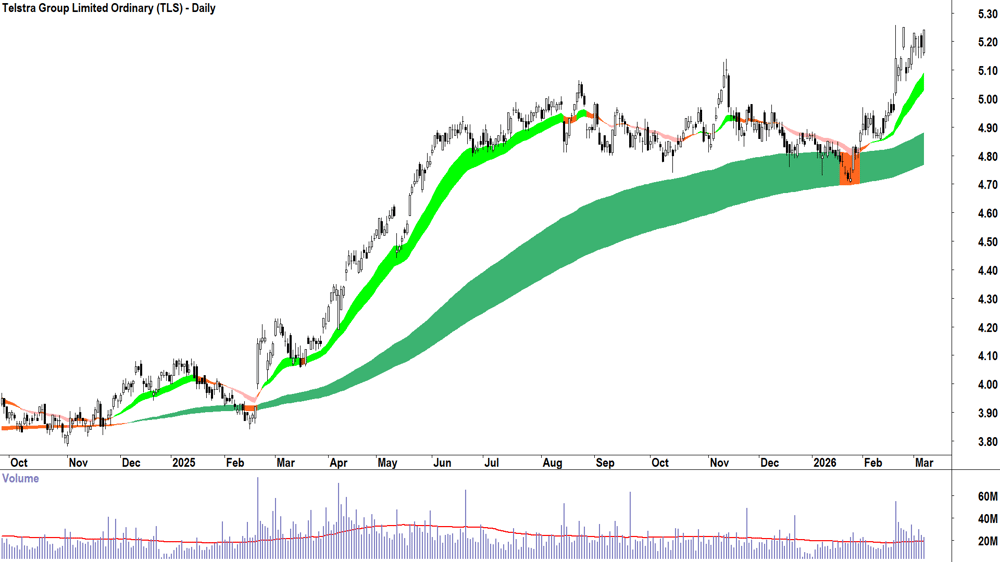
- Telstra Group (TLS)
- Last Price: $5.24
- 1mo %: +6.3%
- 1yr %: +24.8%
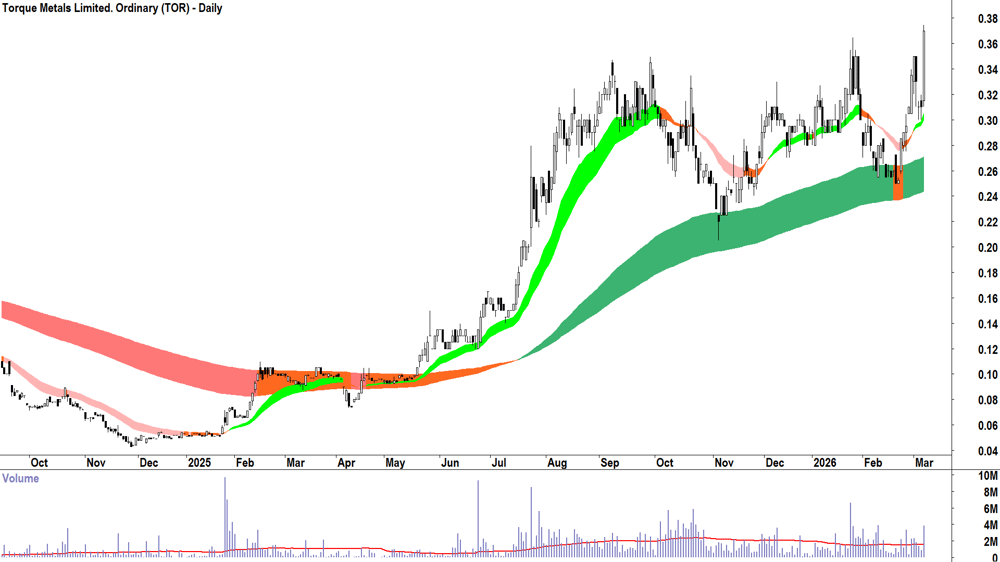
- Torque Metals (TOR)
- Last Price: $0.370
- 1mo %: +32.1%
- 1yr %: +273.7%
- Titan Minerals (TTM)
- Last Price: $1.080
- 1mo %: +16.8%
- 1yr %: +160.2%
- Viking Mines (VKA)
- Last Price: $0.022
- 1mo %: +100.0%
- 1yr %: +144.4%
- Vysarn (VYS)
- Last Price: $0.850
- 1mo %: +21.4%
- 1yr %: +100.0%
- Woodside Energy Group (WDS)
- Last Price: $30.75
- 1mo %: +18.7%
- 1yr %: +25.6%
- Woolworths Group (WOW)
- Last Price: $35.99
- 1mo %: +13.9%
- 1yr %: +20.4%
- Waratah Minerals (WTM)
- Last Price: $0.800
- 1mo %: +34.5%
- 1yr %: +370.6%
Featured Uptrend Charts
From the uptrends list, several stocks stand out for exhibiting particularly strong demand. These include A2 Milk Co. (A2M), Besra Gold (BEZ), Droneshield (DRO), Echoiq (EIQ), Elsight (ELS), Lindian Resources (LIN), Odyssey Gold (ODY), BetaShares Crude Oil ETF (OOO), Pexa Group (PXA), Ramsay Health Care (RHC), Sportshero (SHO), Santos (STO), Telstra Group (TLS), Torque Metals. (TOR), Titan Minerals (TTM), Viking Mines (VKA), and Woodside Energy Group (WDS).
Below are 10 randomly selected charts from this uptrend selection:
Live Technical Analysis Webinars
For those keen to deepen their understanding of technical analysis and trend-following strategies, weekly live webinars are held every Wednesday at 12 pm AEDT. These sessions offer a unique opportunity to learn from a leading technical analyst, Carl Capolingua, who provides real-time analysis of ASX stocks based on viewer requests. Participants can gain expert opinions on their portfolio holdings or any aspect of trading and investing. Due to limited availability, early registration is strongly encouraged.
ASX Downtrends Scan List 📉
This list identifies companies currently in a clear downtrend. These stocks have met specific technical criteria indicating significant selling pressure, which may signal potential risks or opportunities for short sellers.
- Abacus Group (ABG)
- Last Price: $1.020
- 1mo %: -10.9%
- 1yr %: -11.3%
- Arena Reit. (ARF)
- Last Price: $3.32
- 1mo %: -7.5%
- 1yr %: -8.3%
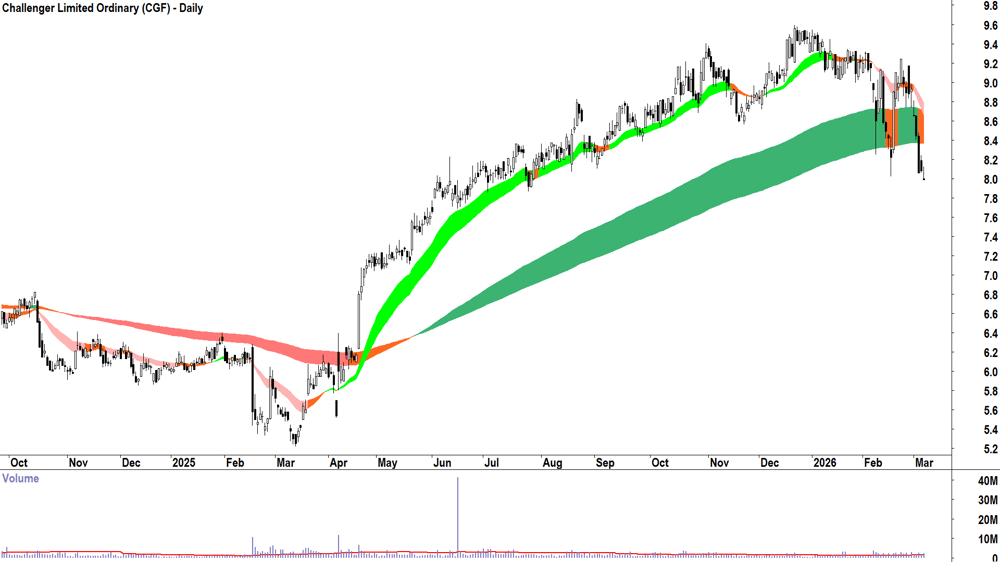
- Challenger (CGF)
- Last Price: $7.99
- 1mo %: -12.7%
- 1yr %: +41.9%
- Charter Hall Group (CHC)
- Last Price: $20.98
- 1mo %: -9.8%
- 1yr %: +22.7%
- Centuria Industrial Reit (CIP)
- Last Price: $3.13
- 1mo %: -3.1%
- 1yr %: +4.0%
- COG Financial Services (COG)
- Last Price: $1.400
- 1mo %: -24.3%
- 1yr %: +38.6%
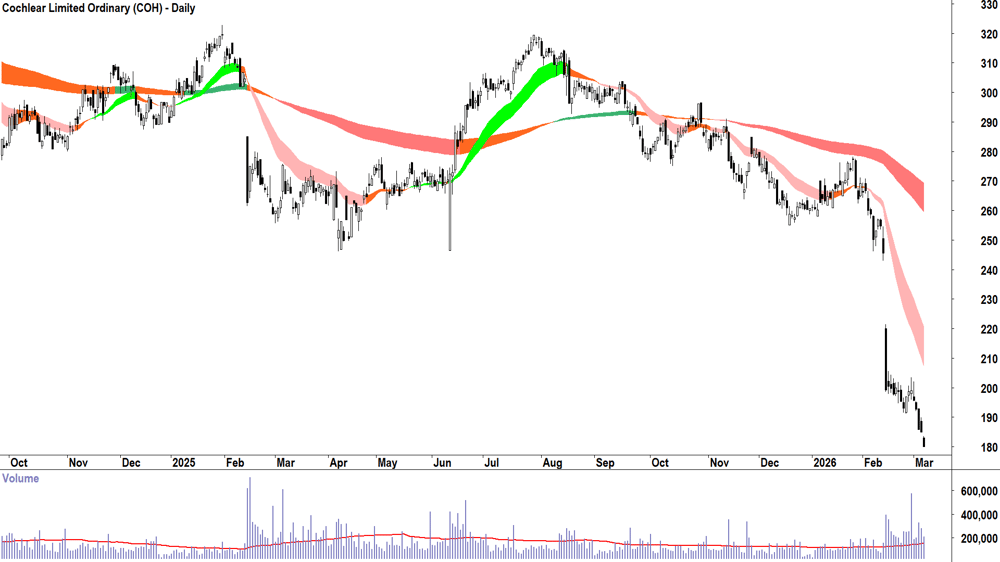
- Cochlear (COH)
- Last Price: $180.06
- 1mo %: -30.4%
- 1yr %: -30.9%
- CH Social Infrastructure Reit (CQE)
- Last Price: $2.77
- 1mo %: -6.4%
- 1yr %: -4.5%
- Dicker Data (DDR)
- Last Price: $8.61
- 1mo %: -13.3%
- 1yr %: +0.7%
- Dexus (DXS)
- Last Price: $6.40
- 1mo %: -2.3%
- 1yr %: -15.5%
- Ebos Group (EBO)
- Last Price: $19.18
- 1mo %: -13.4%
- 1yr %: -44.4%
- Fleetpartners Group (FPR)
- Last Price: $2.47
- 1mo %: -9.9%
- 1yr %: -6.8%
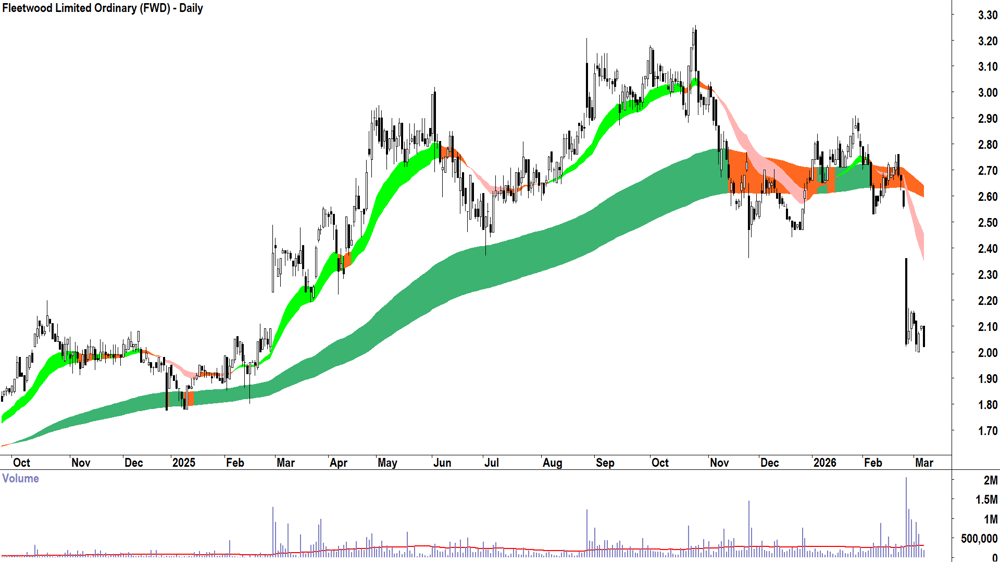
- Fleetwood (FWD)
- Last Price: $2.02
- 1mo %: -23.5%
- 1yr %: -12.9%
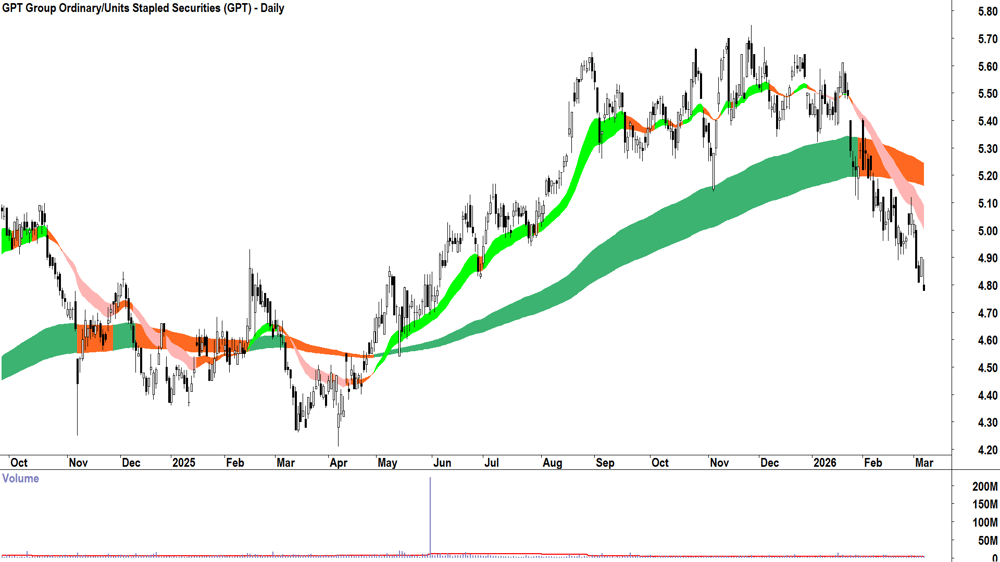
- GPT Group (GPT)
- Last Price: $4.78
- 1mo %: -8.4%
- 1yr %: +2.8%
- Homeco Daily Needs Reit (HDN)
- Last Price: $1.240
- 1mo %: -4.6%
- 1yr %: +2.9%
- Helloworld Travel (HLO)
- Last Price: $1.615
- 1mo %: -19.3%
- 1yr %: -5.3%
- Healius (HLS)
- Last Price: $0.630
- 1mo %: -31.5%
- 1yr %: -36.2%
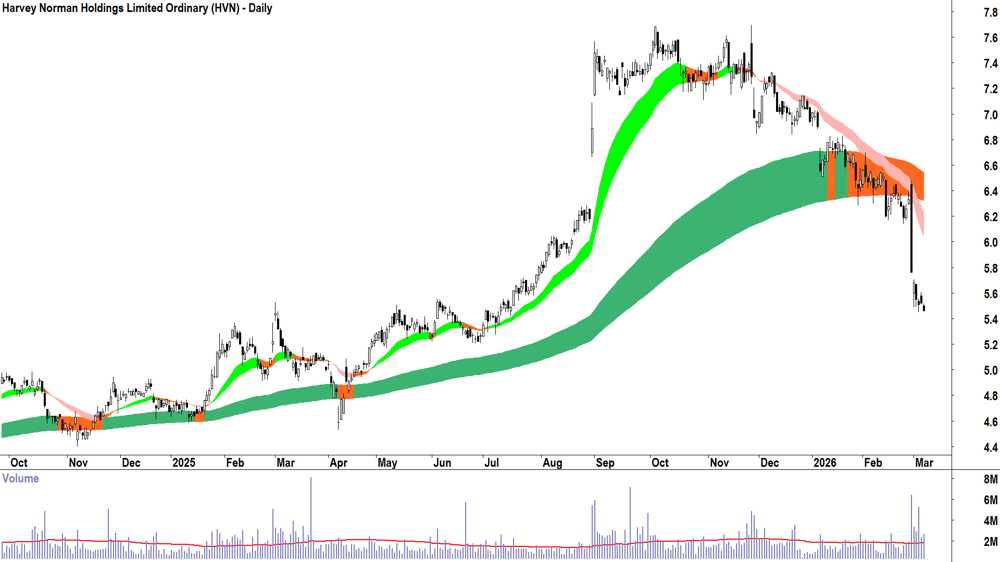
- Harvey Norman (HVN)
- Last Price: $5.46
- 1mo %: -16.5%
- 1yr %: +2.6%
- Lendlease Group (LLC)
- Last Price: $3.83
- 1mo %: -18.0%
- 1yr %: -37.1%
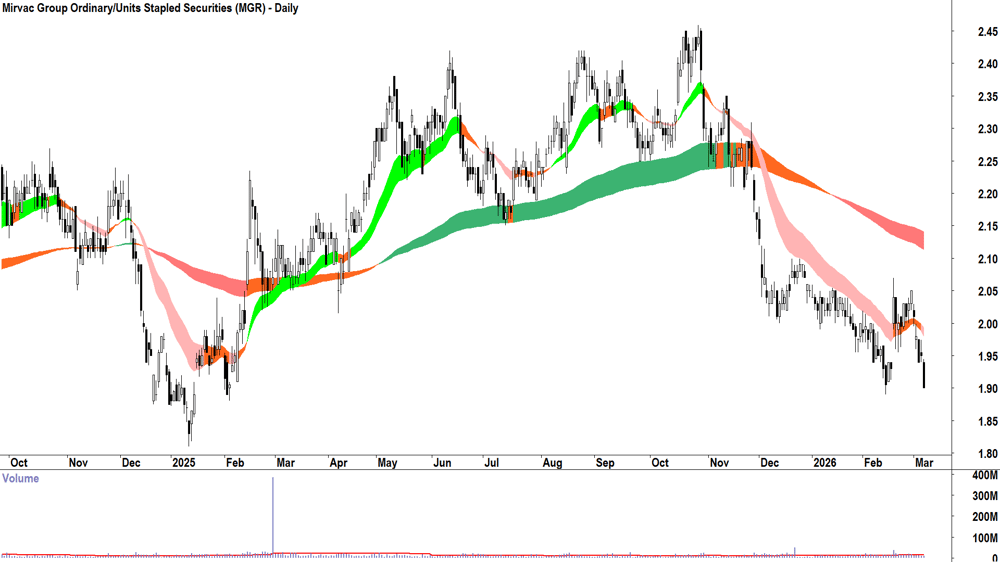
- Mirvac Group (MGR)
- Last Price: $1.900
- 1mo %: -5.0%
- 1yr %: -10.4%
- Medibank Private (MPL)
- Last Price: $4.29
- 1mo %: -6.7%
- 1yr %: -2.7%
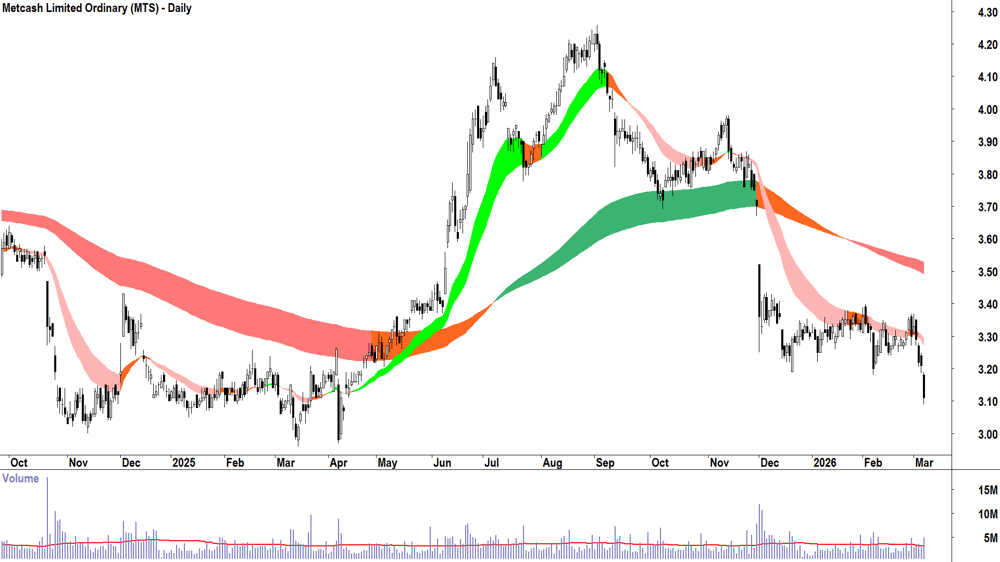
- Metcash (MTS)
- Last Price: $3.11
- 1mo %: -6.3%
- 1yr %: -0.3%
- Myer (MYR)
- Last Price: $0.330
- 1mo %: -21.4%
- 1yr %: -56.3%
- Propel Funeral Partners (PFP)
- Last Price: $4.18
- 1mo %: -15.7%
- 1yr %: -20.2%
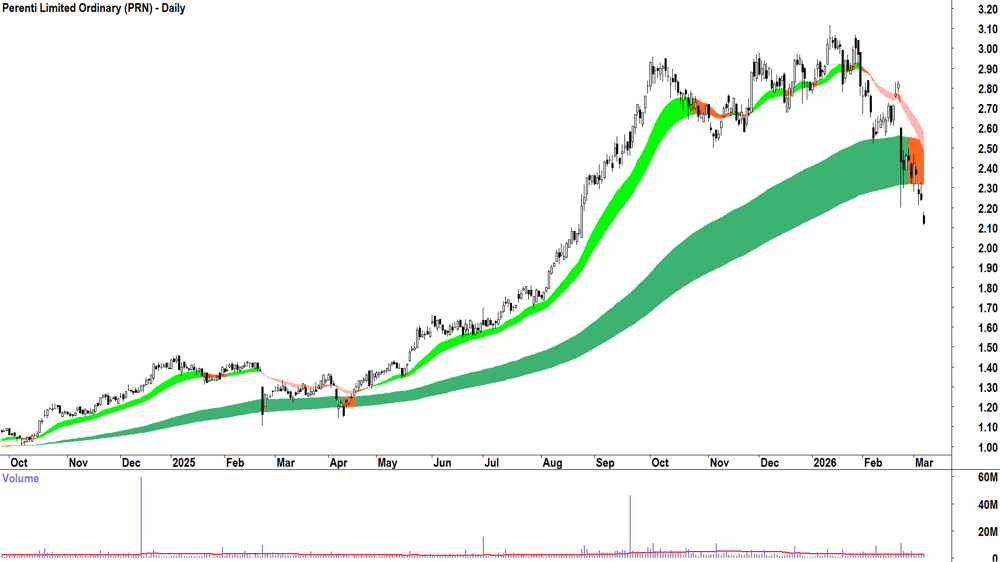
- Perenti (PRN)
- Last Price: $2.12
- 1mo %: -20.9%
- 1yr %: +63.7%
- Qualitas (QAL)
- Last Price: $2.83
- 1mo %: -9.6%
- 1yr %: +2.5%
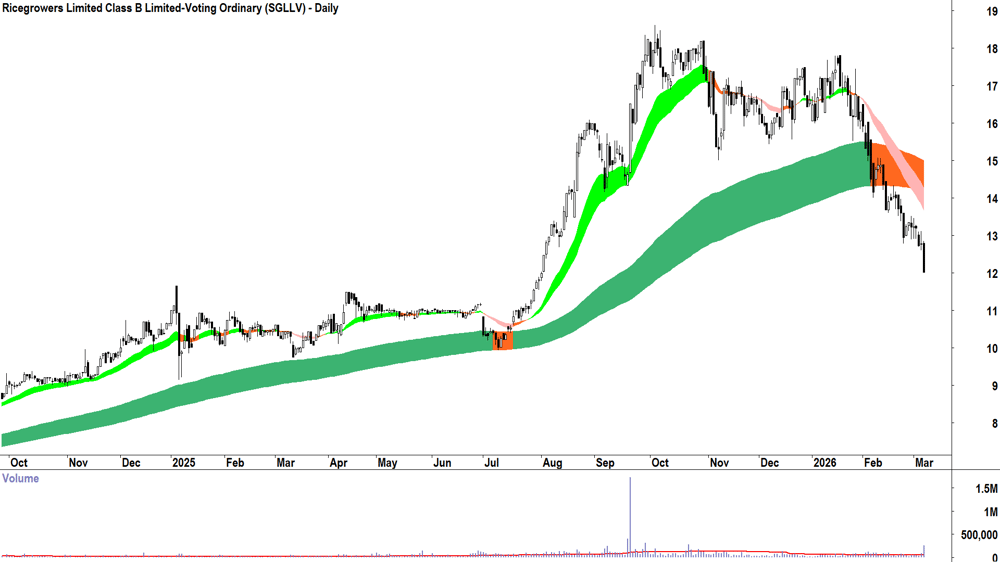
- Ricegrowers (SGLLV)
- Last Price: $12.02
- 1mo %: -17.1%
- 1yr %: +16.4%
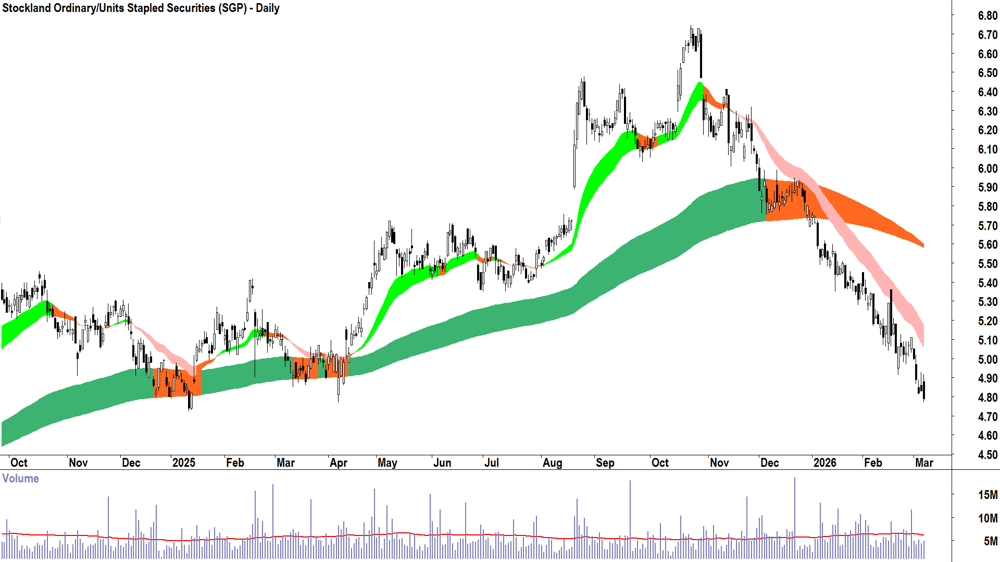
- Stockland (SGP)
- Last Price: $4.79
- 1mo %: -10.3%
- 1yr %: -6.4%
Featured Downtrend Charts
Within the downtrends list, certain stocks exhibit particularly strong selling pressure. These include Challenger (CGF), COG Financial Services (COG), Cochlear (COH), Fleetpartners Group (FPR), Fleetwood (FWD), GPT Group (GPT), Helloworld Travel (HLO), Harvey Norman (HVN), Mirvac Group (MGR), Metcash (MTS), Myer (MYR), Perenti (PRN), Ricegrowers (SGLLV), and Stockland (SGP).
Below are 10 randomly selected charts from this downtrend selection:
Crucial Considerations for Using Scan Lists
When utilising these scan lists, it is essential to keep the following points in mind:
- Understanding the Methodology: For a comprehensive understanding of the trend-following principles behind these scans, refer to “Technical Analysis for Beginners: ChartWatch Primer.”
- Market Volatility: The future performance of any stock is inherently uncertain. Market dynamics can shift rapidly, meaning a stock in a strong uptrend or downtrend today may not maintain that trajectory by the next trading session.
- Curated Selection: These lists are not exhaustive but are carefully curated selections. A stock may not appear on a list for consecutive days, only to re-emerge when its trend meets the criteria again.
- Educational Tool, Not a Recommendation: These lists serve as an educational aid to illustrate the practical application of a technical analysis model. They are not a recommendation service. The responsibility lies with the individual to monitor trends and understand why a stock might be removed from a list.
- Due Diligence is Key: This information is general and for educational purposes only. Always conduct your own thorough research before making any investment decisions.
Free Investment Tools and ASX Research
For investors seeking complimentary resources and comprehensive ASX research, Market Index offers a wealth of tools, including:
- Broker consensus data
- ASX announcement archives
- Detailed dividend information
- And numerous other valuable features.
Access all these resources and more, completely free of charge.